Seven problems. That’s how many obstacles I counted before hardware monitoring for three HP ProLiant servers was finally working. The documentation made it sound so simple: enable SNMP, run check_hpasm, done.
Or: How I learned that “community project” sometimes means “bring your own band-aids”
If you’re facing a similar setup – HP ProLiant servers monitored via iLO, OMD Labs as your monitoring system – this walkthrough will save you considerable frustration.
The Setup
Permalink to "The Setup"Three HP ProLiant DL360p Gen8 servers running VMware ESXi 7.0.3. Each server has an iLO4 management controller with its own network interface:
| Server | ESXi IP | iLO IP |
|---|---|---|
| esxi-01 | 192.168.20.x | 192.168.21.101 |
| esxi-02 | 192.168.20.x | 192.168.21.102 |
| esxi-03 | 192.168.20.x | 192.168.21.103 |
Goal: Comprehensive hardware monitoring – fans, temperatures, power supplies, RAM, RAID – via the iLO interface.
Monitoring System: OMD Labs 5.60 (ConSol Edition) with Naemon as the core and PNP4Nagios for graphing.
Sounds straightforward? It wasn’t.
Problem 1: “Failed to create new file: invalid path”
Permalink to "Problem 1: “Failed to create new file: invalid path”"The very first attempt to create a host through the Thruk web interface greeted me with an error:
Failed to create new file: invalid pathWhat happened? The directory for configuration files simply didn’t exist. OMD Labs is a community project – some basic functionality isn’t perfectly configured out of the box.
The solution:
su - monitoring  # As OMD site user
mkdir -p ~/etc/naemon/conf.d/hosts
mkdir -p ~/etc/naemon/conf.d/services
mkdir -p ~/etc/naemon/conf.d/commands
Lesson learned: For production setups, it’s better to create configurations directly via CLI. The web interface is nice for quick wins but not always reliable.
The ESXi SNMP Detour
Permalink to "The ESXi SNMP Detour"Before tackling iLO, we first tried monitoring ESXi itself via SNMP.
Enabling SNMP on ESXi
Permalink to "Enabling SNMP on ESXi"Via SSH to the ESXi host:
esxcli system snmp set --communities public
esxcli system snmp set --enable true
esxcli network firewall ruleset set --ruleset-id snmp --enabled true
Problem 2: SNMP MIBs Not Loaded
Permalink to "Problem 2: SNMP MIBs Not Loaded"First test:
snmpwalk -v2c -c public esxi-01.example.com sysDescrResult:
sysDescr: Unknown Object Identifier (Sub-id not found: (top) -> sysDescr)The SNMP MIBs weren’t loaded on the OMD server. No big deal – numeric OIDs are more universal anyway:
snmpwalk -v2c -c public esxi-01.example.com .1.3.6.1.2.1.1.1.0Result:
iso.3.6.1.2.1.1.1.0 = STRING: "VMware ESXi 7.0.3 build-24411414 VMware, Inc. x86_64"Lesson learned: Always use numeric OIDs for Nagios/Naemon checks – they work everywhere regardless of installed MIB files.
Why iLO Instead of ESXi?
Permalink to "Why iLO Instead of ESXi?"ESXi SNMP provides basic information (uptime, NICs), but for real hardware monitoring, the iLO controller is the better choice:
- Dedicated hardware management interface – built exactly for this
- Access even when server is powered off – critical for troubleshooting
- More detailed sensor data – 41 temperature sensors instead of a handful
- HP-specific MIBs – CPQHLTH-MIB knows every sensor in the system
Problem 3: SNMP Not Active on iLO
Permalink to "Problem 3: SNMP Not Active on iLO"First test against the iLO IP:
snmpwalk -v2c -c public 192.168.21.101 .1.3.6.1.2.1.1.1.0→ Timeout
SNMP wasn’t enabled on iLO4 or no community was configured.
The solution: In the iLO4 web interface:
- Open browser:
https://192.168.21.101 - Navigate: Administration → Management → SNMP Settings
- Enter Read Community (e.g.,
public– or better, something secure) - Click Apply
After configuration:
snmpwalk -v2c -c public 192.168.21.101 .1.3.6.1.2.1.1.1.0Result:
iso.3.6.1.2.1.1.1.0 = STRING: "Integrated Lights-Out 4 1.50"check_hpasm: The Right Tool for the Job
Permalink to "check_hpasm: The Right Tool for the Job"We could have written individual SNMP checks for each sensor. But check_hpasm
is specifically designed for HP ProLiant hardware:
- Automatic detection of all components
- Aggregated health status
- Performance data for all sensors
- Human-readable output
Problem 4: Perl Locale Warning
Permalink to "Problem 4: Perl Locale Warning"First invocation:
~/lib/nagios/plugins/check_hpasm -H 192.168.21.101 -C publicWarnings appeared:
perl: warning: Setting locale failed.
perl: warning: Please check that your locale settings:
    LANGUAGE = (unset),
    LC_ALL = (unset),
    LANG = "en_US.UTF-8"
    are supported and installed on your system.
The locale settings in the OMD site environment weren’t properly configured.
The solution:
echo 'export LC_ALL=C' >> ~/.profile
source ~/.profile
After that, the check ran cleanly:
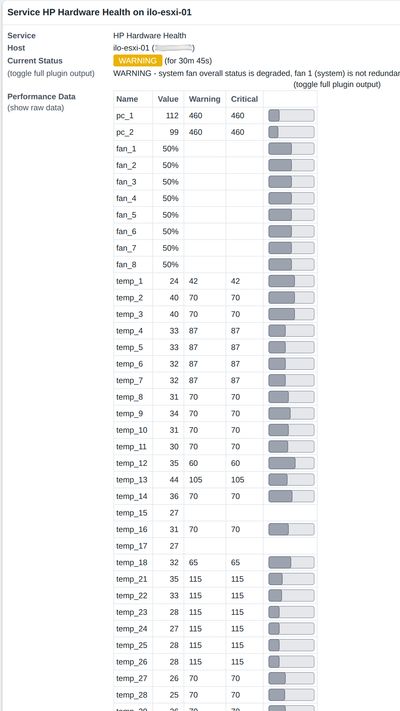
WARNING - system fan overall status is degraded, fan 6 (system) degraded,
System: 'proliant dl360p gen8', S/N: 'XXXXXXXXXX', ROM: 'P71 07/01/2015'
Result: The check immediately found a real hardware issue – Fan 6 is degraded!
Problem 5: --perfdata Option Doesn’t Work
Permalink to "Problem 5: --perfdata Option Doesn’t Work"We wanted to enable performance data for graphs:
~/lib/nagios/plugins/check_hpasm -H 192.168.21.101 -C public --perfdataError message:
Option perfdata requires an argumentThe OMD version of check_hpasm was compiled without --enable-perfdata. The
option expects a value.
The solution: Explicitly use --perfdata=short:
~/lib/nagios/plugins/check_hpasm -H 192.168.21.101 -C public --perfdata=shortResult with performance data:
WARNING - system fan overall status is degraded... | pc_1=112;460;460 pc_2=99;460;460
fan_1=50% fan_2=50% ... temp_1=24;42;42 temp_2=40;70;70 ...
Naemon Configuration
Permalink to "Naemon Configuration"Architecture Decision: Separate iLO Hosts
Permalink to "Architecture Decision: Separate iLO Hosts"Important design decision: Define iLO hosts separately from ESXi hosts:
- Different IPs – iLO has its own management network
- Future-proof – New HP servers without ESXi fit the schema
- Clear separation – Hardware monitoring vs. virtualization
File: ~/etc/naemon/conf.d/hosts/ilo-hosts.cfg
# iLO Hostgroup
define hostgroup {
    hostgroup_name          ilo-servers
    alias                   HP iLO Management Interfaces
}

# iLO Host Template
define host {
    name                    ilo-host
    use                     generic-host
    check_command           check-host-alive
    check_interval          5
    register                0
}

# iLO Hosts
define host {
    use                     ilo-host
    host_name               ilo-esxi-01
    alias                   iLO ESXi-01 (DL360p Gen8)
    address                 192.168.21.101
    hostgroups              ilo-servers
}

define host {
    use                     ilo-host
    host_name               ilo-esxi-02
    alias                   iLO ESXi-02 (DL360p Gen8)
    address                 192.168.21.102
    hostgroups              ilo-servers
}

define host {
    use                     ilo-host
    host_name               ilo-esxi-03
    alias                   iLO ESXi-03 (DL360p Gen8)
    address                 192.168.21.103
    hostgroups              ilo-servers
}
File: ~/etc/naemon/conf.d/commands/check_hpasm.cfg
define command {
    command_name    check_hpasm
    command_line    $USER1$/check_hpasm -H $HOSTADDRESS$ -C $ARG1$ --perfdata=short
}
File: ~/etc/naemon/conf.d/services/hpasm-services.cfg
define service {
    use                     generic-service
    hostgroup_name          ilo-servers
    service_description     HP Hardware Health
    check_command           check_hpasm!public
    check_interval          5
}
Problem 6: Hostgroup Not Found
Permalink to "Problem 6: Hostgroup Not Found"omd checkError message:
Error: Could not find any hostgroup matching 'ilo-servers'The hostgroup definition was missing or not loaded correctly.
The solution: Ensure the hostgroup is defined in the same file or before the services. After correction:
omd check && omd reload naemonCheck Status via Livestatus
Permalink to "Check Status via Livestatus"echo "GET services
Filter: description = HP Hardware Health
Columns: host_name description state plugin_output" | unixcat ~/tmp/run/liveResult:
ilo-esxi-01;HP Hardware Health;1;WARNING - system fan overall status is degraded, fan 6 (system) degraded...
ilo-esxi-02;HP Hardware Health;2;CRITICAL - dimm module 0:12 (module 12 @ cartridge 0) needs attention (degraded)...
ilo-esxi-03;HP Hardware Health;0;OK - System: 'proliant dl360p gen8', hardware working fine...
PNP4Nagios Graphing
Permalink to "PNP4Nagios Graphing"After a few check cycles:
ls ~/var/pnp4nagios/perfdata/ilo-esxi-01/HP_Hardware_Health.xml
HP_Hardware_Health_fan_1.rrd
HP_Hardware_Health_fan_2.rrd
...
HP_Hardware_Health_temp_1.rrd
HP_Hardware_Health_temp_2.rrd
...8 fans, 41 temperature sensors, 2 power consumption values – perfect!

Problem 7: PNP4Nagios Shows Error Instead of Graphs
Permalink to "Problem 7: PNP4Nagios Shows Error Instead of Graphs"When opening PNP4Nagios in the browser:
Please check the documentation for information about the following error.

Undefined array key 14

file [line]:
templates.dist/check_hpasm.php [35]:
The bundled PNP4Nagios template for check_hpasm defines only 14 colors:
$colors=array("CC3300","CC3333","CC3366",...); // only 14 entriesBut our DL360p Gen8 has 41 temperature sensors! At sensor 15, there’s no color entry → array index error.
The solution: Custom template with more colors and cyclic usage:
File: ~/share/pnp4nagios/htdocs/templates/check_hpasm.php
<?php
#
# Fixed check_hpasm template with more colors
#
$colors=array(
    "CC3300","CC3333","CC3366","CC3399","CC33CC","CC33FF",
    "336600","336633","336666","336699","3366CC","3366FF",
    "33CC33","33CC66","33CC99","33CCCC","33CCFF","339900",
    "339933","339966","339999","3399CC","3399FF","993300",
    "993333","993366","993399","9933CC","9933FF","996600",
    "996633","996666","996699","9966CC","9966FF","999900",
    "999933","999966","9999CC","9999FF","00CC00","00CC33",
    "00CC66","00CC99","00CCCC","00CCFF","0099FF","0066FF"
);
$max_rpm=5400;
$col_f=0;
$col_t=0;
$num_colors=count($colors);

foreach($DS as $KEY => $VAL){
    if(preg_match('/^fan_/',$NAME[$KEY])){
        $ds_name[1] = "Fan Speed";
        $opt[1] = "-X0 --slope-mode -u $max_rpm --vertical-label \"RPMs\"  --title \"HPASM Fan Speed\" ";
        if(!isset($def[1])){
            $def[1] = "";
        }
        $def[1] .= "DEF:ovar$KEY=$RRDFILE[$KEY]:$DS[$KEY]:AVERAGE " ;
        $def[1] .= "CDEF:var$KEY=ovar$KEY,100,/,$max_rpm,* " ;
        // Modulo operator for cyclic color usage
        $def[1] .= "LINE:var$KEY#".$colors[$col_f % $num_colors].":\"$NAME[$KEY]\" " ;
        $def[1] .= "GPRINT:var$KEY:LAST:\"%6.0lf RPM LAST \" ";
        $def[1] .= "GPRINT:var$KEY:MAX:\"%6.0lf RPM MAX \" ";
        $def[1] .= "GPRINT:var$KEY:AVERAGE:\"%6.2lf RPM AVERAGE \\n\" ";
        $col_f++;
    }
    if(preg_match('/^temp_/',$NAME[$KEY])){
        $ds_name[2] = "Temperature";
        $opt[2] = "--slope-mode --vertical-label \"Celsius\"  --title \"HPASM Temperature\" ";
        if(!isset($def[2])){
            $def[2] = "";
        }
        $def[2] .= "DEF:var$KEY=$RRDFILE[$KEY]:$DS[$KEY]:AVERAGE " ;
        // Modulo operator for cyclic color usage
        $def[2] .= "LINE:var$KEY#".$colors[$col_t % $num_colors].":\"$NAME[$KEY]\\t\" " ;
        $def[2] .= "GPRINT:var$KEY:LAST:\"%6.0lf $UNIT[$KEY] LAST \" ";
        $def[2] .= "GPRINT:var$KEY:MAX:\"%6.0lf $UNIT[$KEY] MAX \" ";
        $def[2] .= "GPRINT:var$KEY:AVERAGE:\"%6.2lf $UNIT[$KEY] AVERAGE \\n\" ";
        $col_t++;
    }
    // Additional: Power Consumption Graph
    if(preg_match('/^pc_/',$NAME[$KEY])){
        $ds_name[3] = "Power Consumption";
        $opt[3] = "--slope-mode --vertical-label \"Watts\"  --title \"HPASM Power Consumption\" ";
        if(!isset($def[3])){
            $def[3] = "";
        }
        $def[3] .= "DEF:var$KEY=$RRDFILE[$KEY]:$DS[$KEY]:AVERAGE " ;
        $def[3] .= "LINE:var$KEY#".$colors[$KEY % $num_colors].":\"$NAME[$KEY]\" " ;
        $def[3] .= "GPRINT:var$KEY:LAST:\"%6.0lf W LAST \" ";
        $def[3] .= "GPRINT:var$KEY:MAX:\"%6.0lf W MAX \" ";
        $def[3] .= "GPRINT:var$KEY:AVERAGE:\"%6.2lf W AVERAGE \\n\" ";
    }
}
?>
After the fix:
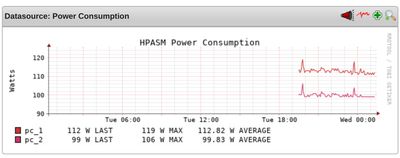
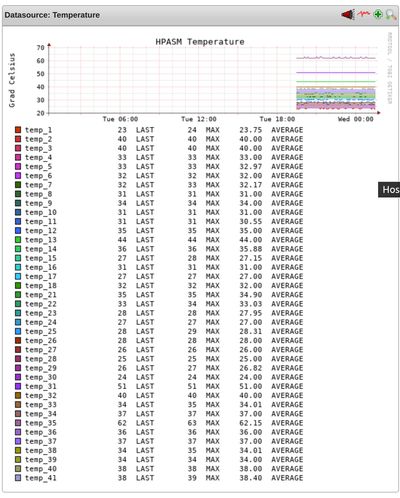
omd reload apacheNow three separate graphs are displayed:
- Fan Speed – All 8 fans
- Temperature – All 41 temperature sensors
- Power Consumption – Power usage of both PSUs


What Did We Learn?
Permalink to "What Did We Learn?"The Seven Pitfalls at a Glance
Permalink to "The Seven Pitfalls at a Glance"| Problem | Cause | Solution |
|---|---|---|
| “Failed to create new file” | Directories missing | mkdir -p ~/etc/naemon/conf.d/{hosts,...} |
| SNMP OID “Unknown” | MIBs not loaded | Use numeric OIDs |
| iLO SNMP Timeout | Community not configured | Enter “Read Community” in iLO web UI |
| Perl Locale Warning | LC_ALL not set | export LC_ALL=C in ~/.profile |
| –perfdata without argument | Compile option missing | Use --perfdata=short |
| Hostgroup not found | Definition missing | Add hostgroup to config file |
| PNP “Undefined array key” | Too few colors | Custom template with 48+ colors |
The Real Payoff
Permalink to "The Real Payoff"Yes, the setup was more involved than expected. But the monitoring immediately paid for itself:
- Fan 6 on server 1 is degraded – without redundancy, this would have led to a thermal shutdown
- DIMM 0:12 on server 2 is defective – ECC is still correcting, but the module needs replacement
Both issues would likely have gone unnoticed without active hardware monitoring until it was too late. (I knew about them, of course!)
File Structure for Reference
Permalink to "File Structure for Reference"~/etc/naemon/conf.d/
├── commands/
│ └── check_hpasm.cfg
├── hosts/
│ └── ilo-hosts.cfg
└── services/
└── hpasm-services.cfg
~/share/pnp4nagios/htdocs/templates/
└── check_hpasm.php # Custom templateConclusion
Permalink to "Conclusion"Seven problems, seven solutions. A long evening with SNMP, Perl, and way too many temperature sensors. But in the end, we have solid hardware monitoring that also found the known defects (good proof of concept ;)).
Was it worth the effort? Absolutely. Finding hardware problems before they become critical is priceless.
